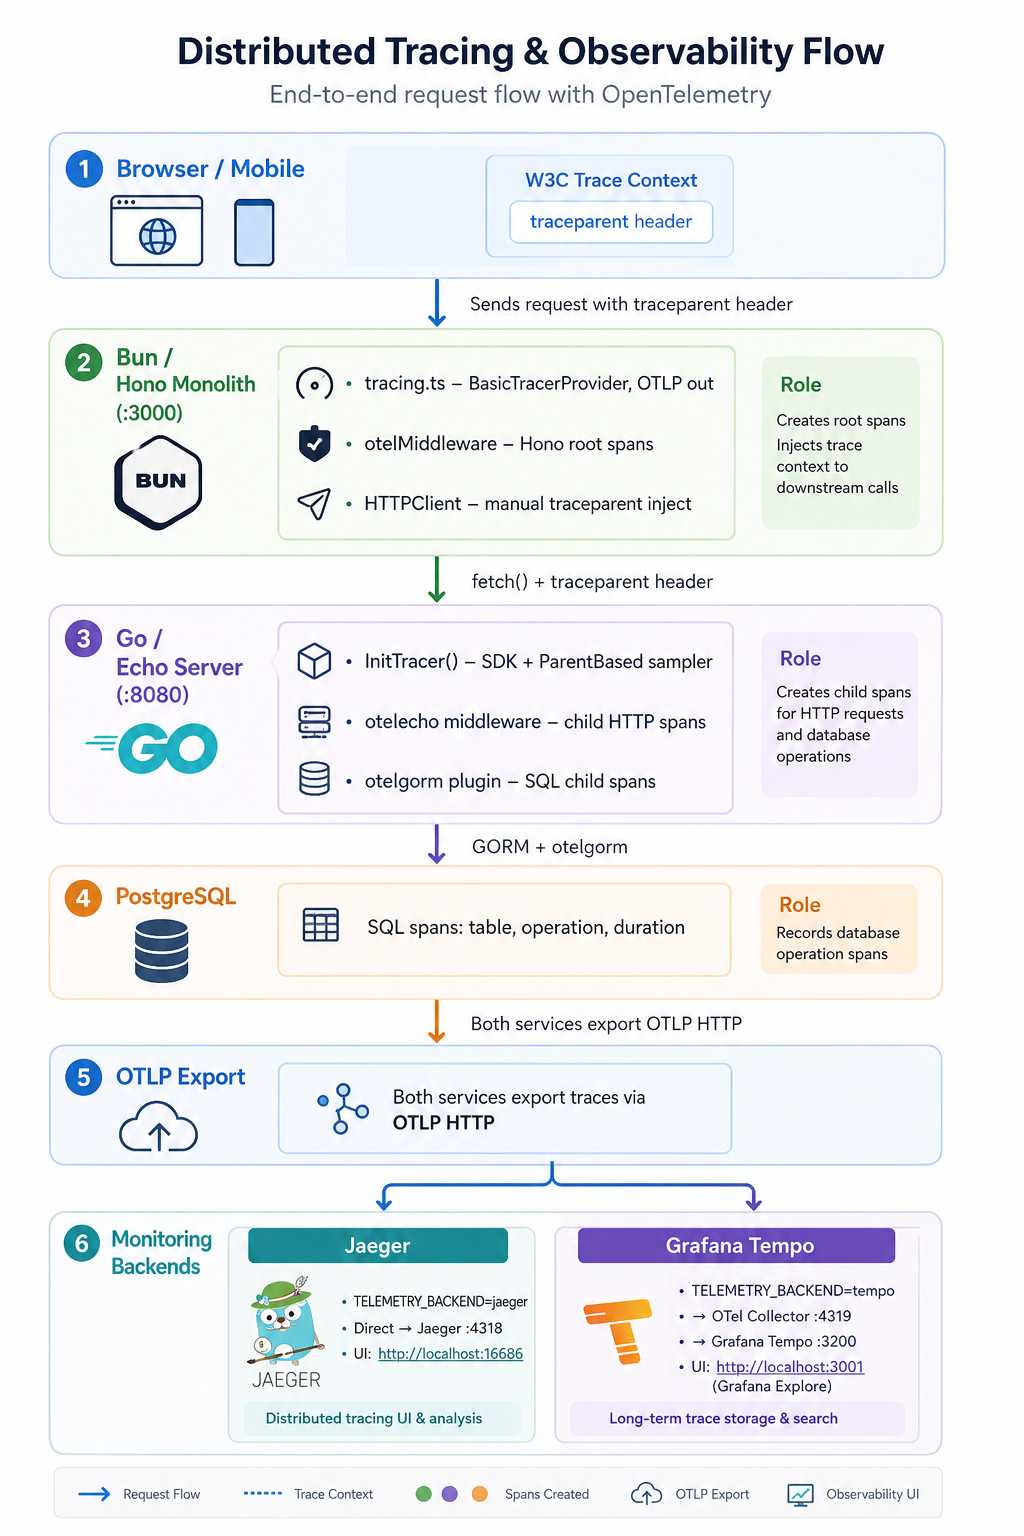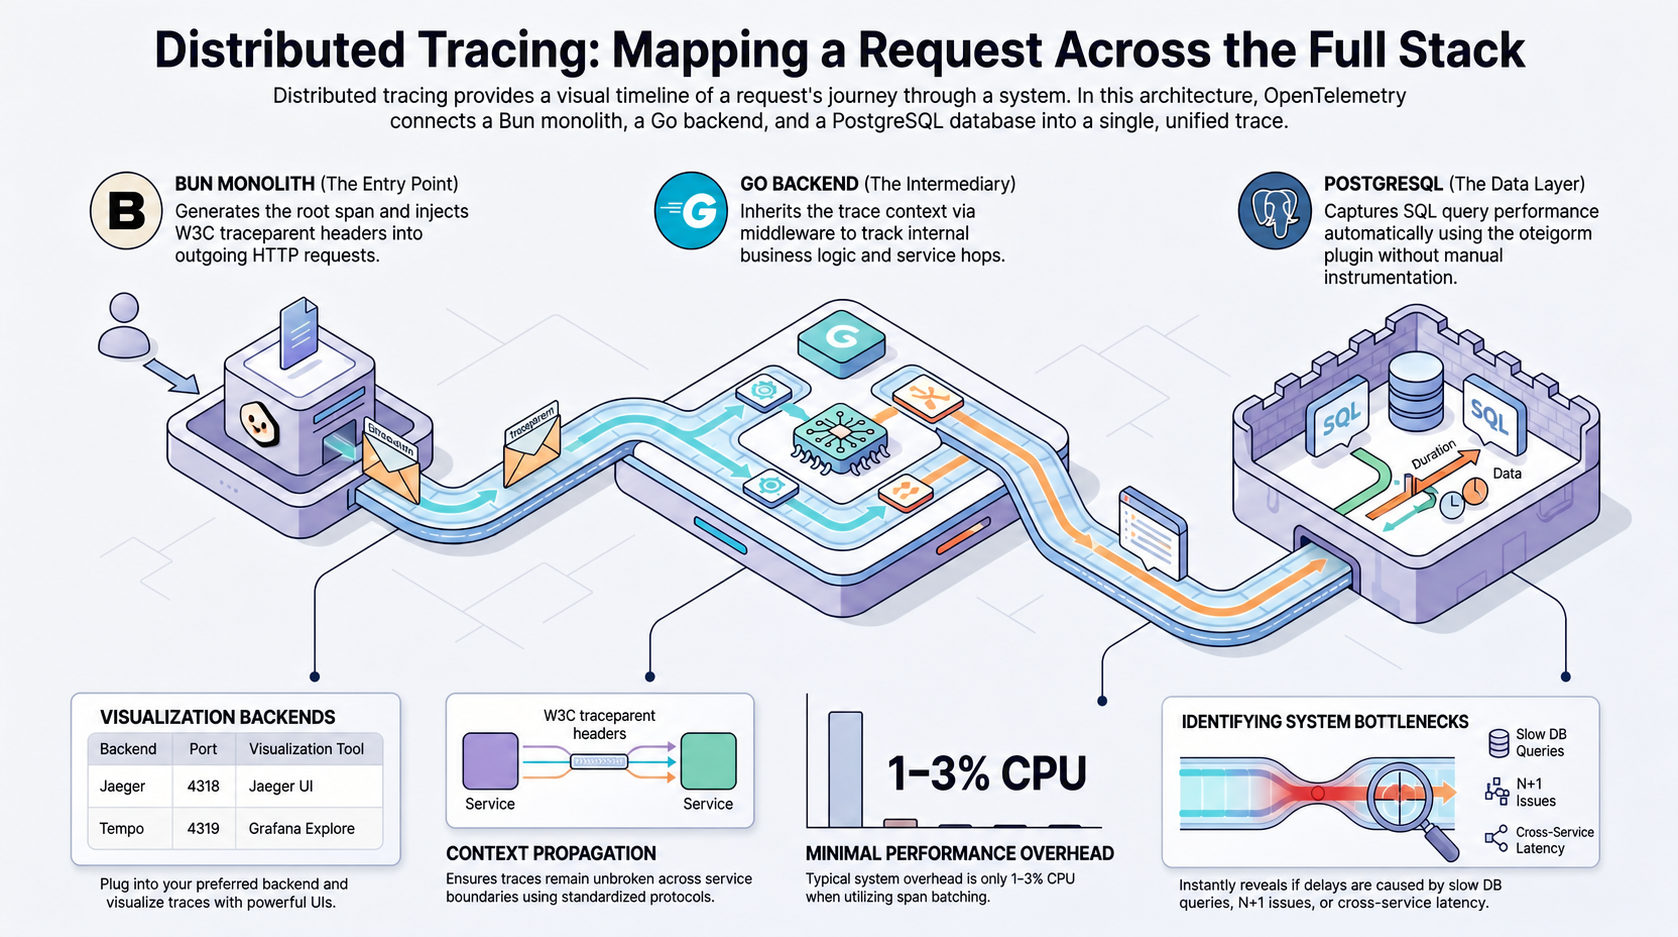
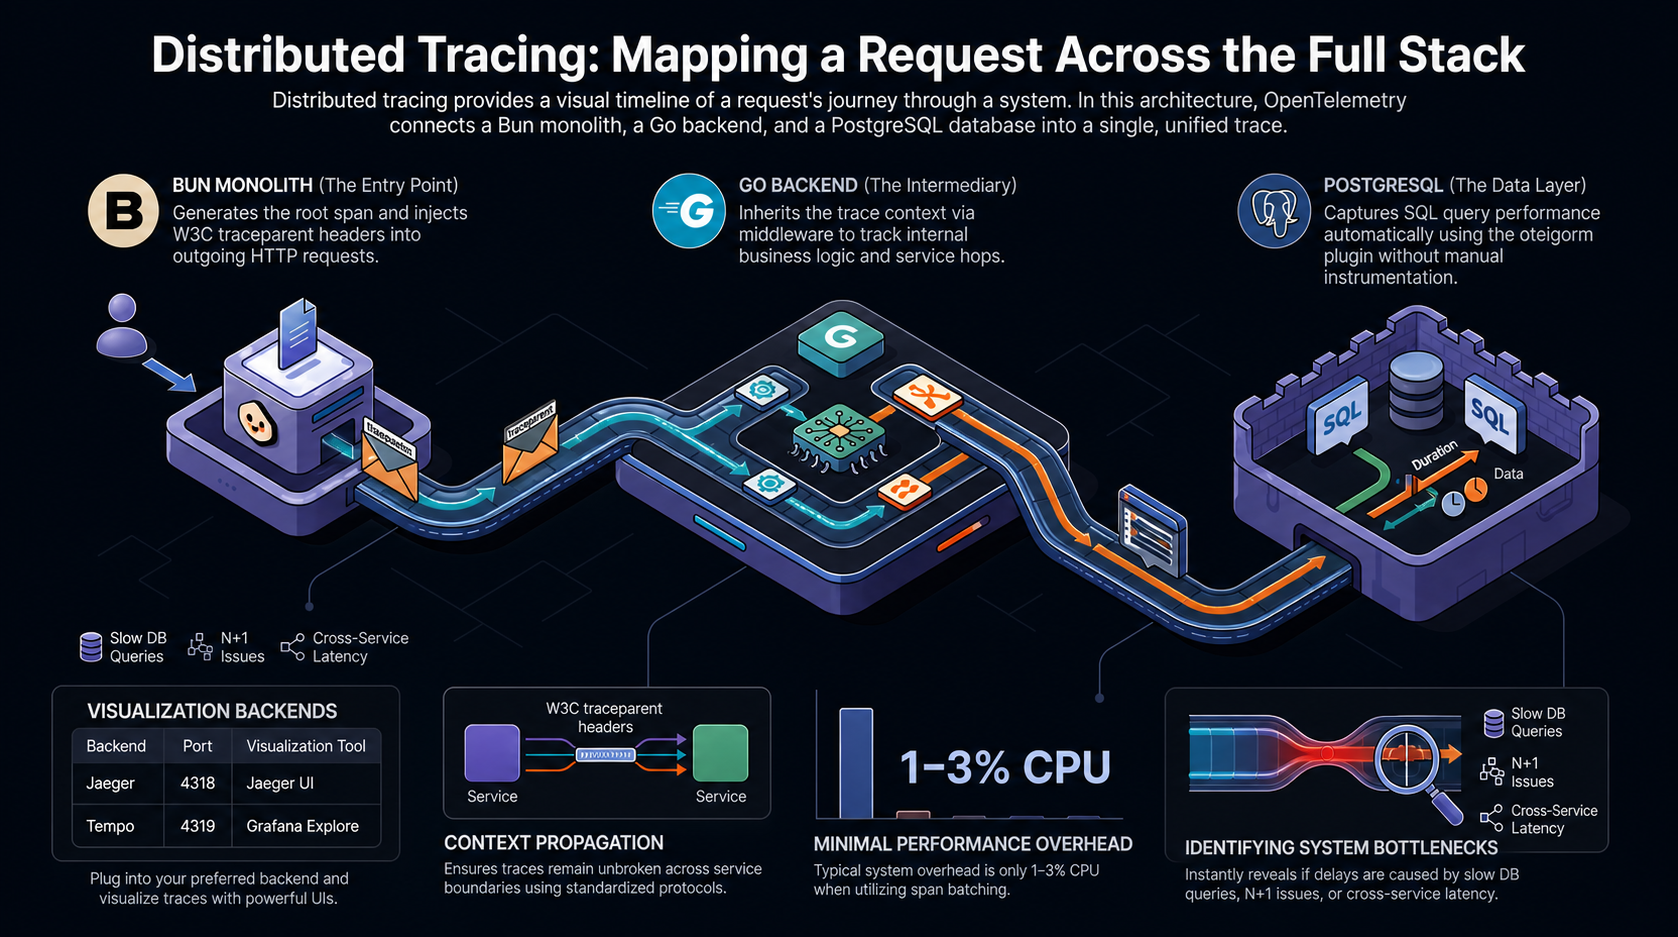
Distributed Tracing with OpenTelemetry Distributed tracing is active across the full stack: Bun monolith → Go backend → PostgreSQL. Every request creates a single trace in Jaeger or Tempo spanning all three layers.

1. What is Distributed Tracing?

When a user makes a request, it touches multiple components: HTTP handlers, business logic, database queries, and potentially multiple services. Distributed Tracing tracks the entire journey as a single timeline. Without tracing, diagnosing “Why is this API slow?” requires manually correlating logs. With tracing, you get a visual breakdown of exactly where time was spent.

2. Architecture

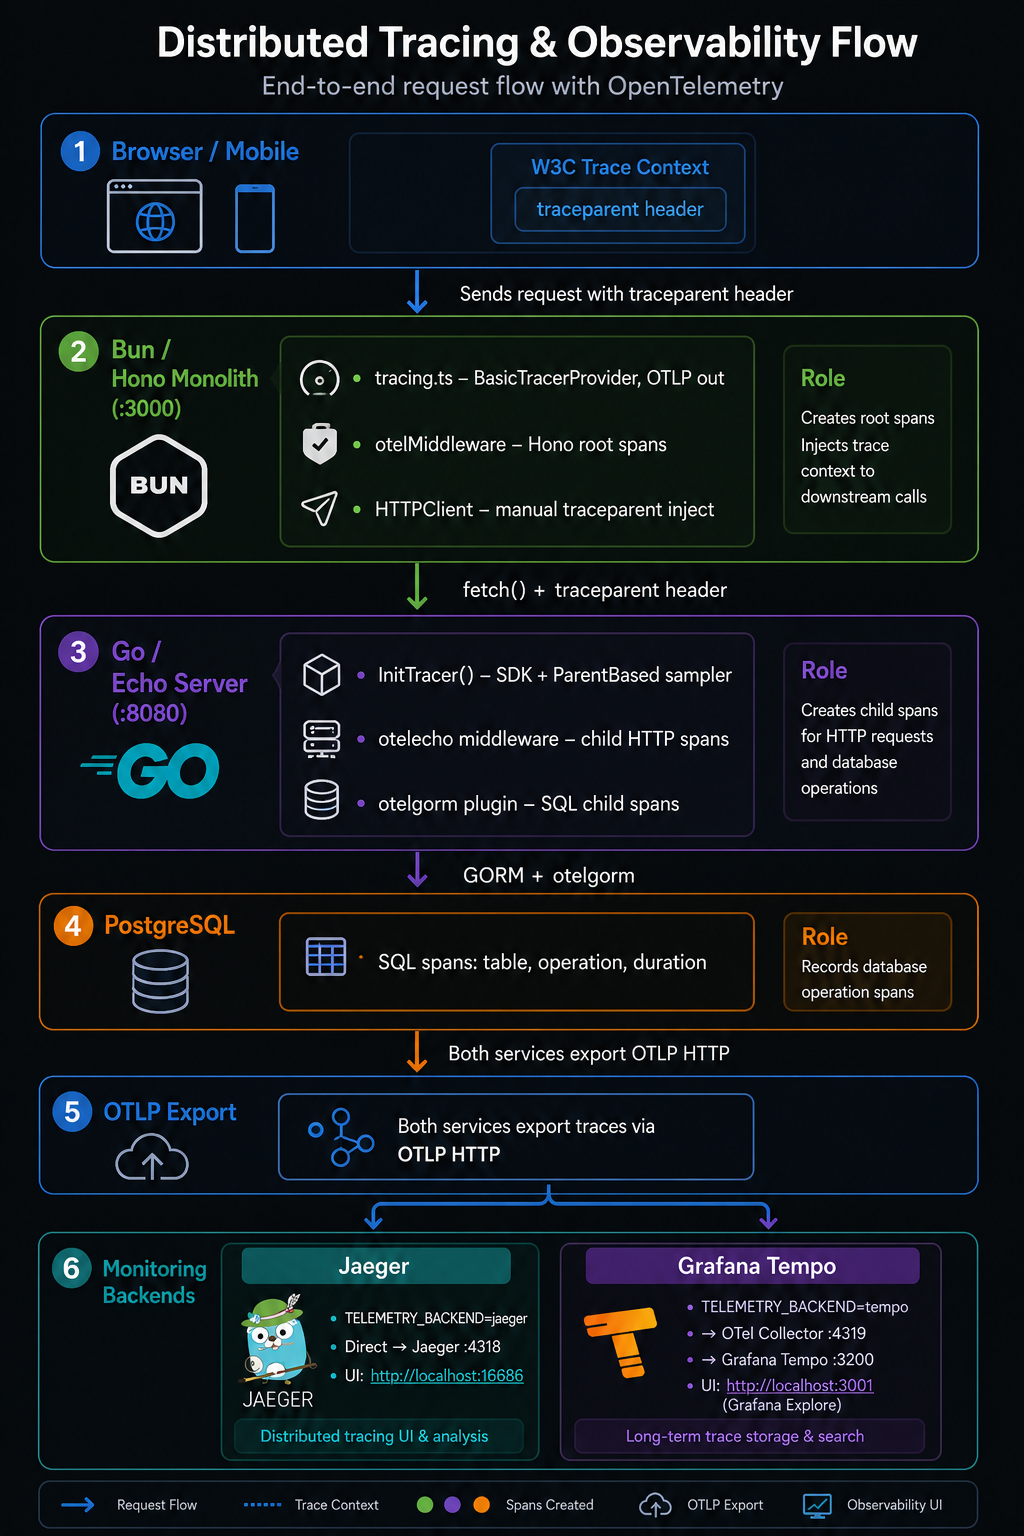
End to end request flow with OpenTelemetry

3. E2E Trace Example

A request to list org permissions produces a single trace:
Trace: abc123  duration: 180ms

├── [bun-monolith] GET /api/organizations/:id/permissions   180ms
│   └── [go-core]  GET /api/organizations/:id/permissions   155ms
│       ├── [db] org_permissions.Find                         9ms
│       ├── [db] user_roles.Find                              5ms
│       └── [db] team_memberships.Find                       48ms  ← slow
The 48ms team_memberships query is immediately visible in Jaeger without any manual instrumentation.

4. Feature Flag & Runtime Toggle

Tracing has two control layers:
Layer 1 — Startup gate (env var, requires restart)
  TELEMETRY_ENABLED=false → SDK never initialised, zero overhead
  TELEMETRY_ENABLED=true  → SDK starts, runtime toggle takes effect

Layer 2 — Runtime toggle (no restart needed)
  POST /admin/telemetry {"enabled": false} → all spans dropped immediately
  POST /admin/telemetry {"enabled": true}  → resumes at current sampling rate
The admin endpoint is protected by AuthMiddleware and only registered when TELEMETRY_ENABLED=true at startup.

Admin Endpoint

GET /admin/telemetry
# Returns: {"enabled": true, "rate": 1.0}

POST /admin/telemetry
Content-Type: application/json
{"enabled": false}          # stop traces without restart
{"rate": 0.1}               # sample 10% of traces
{"enabled": true, "rate": 1.0}  # re-enable at full rate

5. Sampling Strategy

ParentBased(DynamicSampler)

├── If no parent → sample at DynamicSampler.rate (default 100% dev)
├── If parent sampled → always sample (inherit decision)
├── If parent not sampled → never sample (inherit decision)
└── DynamicSampler.enabled = false → drop all regardless of parent
ParentBased ensures DB spans (created by otelgorm) inherit the HTTP span’s sampling decision. No per-query configuration needed.

6. Go Backend

Key files

FileRole
internal/shared/infrastructure/telemetry/tracer.goSDK init, OTLP exporter, ParentBased sampler
internal/shared/infrastructure/telemetry/sampler.goDynamicSampler with enabled toggle and SetSamplingRate
internal/shared/infrastructure/telemetry/handler.goPOST /admin/telemetry handler
internal/shared/infrastructure/database/postgresql/connection.gootelgorm.NewPlugin() registration
cmd/server/main.goInitTracer() call, otelecho middleware, admin route registration

Dependencies

go get go.opentelemetry.io/contrib/instrumentation/github.com/labstack/echo/otelecho
go get github.com/uptrace/opentelemetry-go-extra/otelgorm

Environment variables

VariableDefaultNotes
TELEMETRY_ENABLEDtrueGate for SDK init
TELEMETRY_BACKENDjaegerOptions: jaeger (port 4318) or tempo (port 4319)
TELEMETRY_COLLECTOR_URLOptional override for the backend-derived URL

7. Bun Backend

Key files

FileRole
packages/infrastructure/telemetry/tracing.tsinitTracing() — BasicTracerProvider init, OTLP HTTP exporter
apps/monolith/src/main.tsCalls initTracing() before other modules load
apps/monolith/src/api-gateway/app.tsAdds otelMiddleware to create root spans for incoming HTTP requests
packages/infrastructure/http/http-client.tsManually injects traceparent via propagation.inject

Dependencies

bun add @opentelemetry/api @opentelemetry/core \
  @opentelemetry/exporter-trace-otlp-http \
  @opentelemetry/resources \
  @opentelemetry/sdk-trace-base \
  @opentelemetry/semantic-conventions

traceparent propagation

Due to Bun’s runtime differences with Node.js, we avoid NodeSDK and Node-specific instrumentations like UndiciInstrumentation. Instead, HTTPClient manually injects the W3C traceparent context into outgoing request headers using propagation.inject(). This ensures traces continue unbroken into the Go backend.

Environment variables

VariableDefaultNotes
TELEMETRY_ENABLEDfalseGate for SDK init
TELEMETRY_BACKENDjaegerOptions: jaeger (port 4318) or tempo (port 4319)
TELEMETRY_COLLECTOR_URLOptional override for the backend-derived URL

8. Local Development

The infrastructure services (MongoDB, Redis, NATS, and Telemetry) have been consolidated into the root infra/ directory.

Tracing Backends

You can choose your preferred tracing backend via TELEMETRY_BACKEND in your .env. Option A: Jaeger (Default)
  • Exposes OTLP HTTP on :4318
  • Start it: docker compose -f infra/docker-compose.yml up -d jaeger
  • UI: http://localhost:16686
Option B: Grafana Tempo + OTel Collector
  • The otel-collector receives traces on :4319 and forwards them to Tempo.
  • Tempo stores the traces, and Grafana visualizes them.
  • Start them: docker compose -f infra/docker-compose.yml up -d otel-collector tempo grafana
  • UI: http://localhost:3001 (Navigate to Explore → Data source: Tempo)

Verify tracing

  1. Start your preferred backend (see above)
  2. Start Go/Bun backends with TELEMETRY_ENABLED=true
  3. Make a request: curl http://localhost:8080/api/organizations
  4. Open your backend’s UI and search for traces from go-core or bun-monolith.

Disable tracing at runtime

curl -X POST http://localhost:8080/admin/telemetry \
  -H "Authorization: Bearer $TOKEN" \
  -H "Content-Type: application/json" \
  -d '{"enabled": false}'

9. Core Concepts

Span

A single unit of work: span_id, parent_span_id, name, start/end timestamps, attributes, status. Spans form a tree matching the call hierarchy.

Context Propagation

The W3C traceparent header carries the trace_id and span_id across service boundaries:
traceparent: 00-0af7651916cd43dd8448eb211c80319c-b7ad6b7169203331-01

What to look for in Jaeger or Tempo

ScenarioWhat tracing shows
Slow APIWhich span (DB? External call?) consumed the time
ErrorsExact span where error occurred, with stack trace
N+1 queriesMany small DB spans instead of one batched query
Cross-service latencyWhich hop added the most overhead

10. Production Considerations

  • Sampling: Default is 100% locally. Set TELEMETRY_COLLECTOR_URL to your collector and reduce rate via POST /admin/telemetry {"rate": 0.1} or restart with a lower default.
  • TLS: The OTLP exporter uses WithInsecure() for local dev. In production, configure TLS via the collector.
  • Span attributes: Avoid logging PII (emails, tokens) as span attributes.
  • Performance: Typical overhead is 1–3% CPU with batching. Setting TELEMETRY_ENABLED=false gives zero overhead.